SEO Content Tracking: How to Track Performance & SEO Scores
Topic: SEO
Published:
Written by: Bernard Huang
You have to look beyond rankings and organic traffic to get a full understanding of how your website content performs in search engines. Metrics like SEO scores, click-through rates (CTRs), time on page, and conversions (among others) paint a more holistic picture of content performance.
Reporting on a fuller scope of SEO metrics lets you monitor where content is found in search engines, see how content compares to SERP competitors, and measure the success of content with readers. Then, you can see where to make changes if content is underperforming and double down on SEO strategies that work for you.
We put together this guide to review the most important metrics for tracking SEO content performance in search engines and with target audiences. We explain how to report on this data and show you the tools we use in our processes. And you don’t need a whole tech stack, you can gather all of these metrics with a few solutions.
Content SEO score
Most writers focused on SEO content use content optimization software (like Clearscope!) to inform on-page strategies and efficiently produce SEO-friendly content — these software solutions provide SEO reports with recommendations to guide content writing workflows and show you what’s important to achieving page-one rankings.
In some cases, the tools you use to create optimized content also have features to track content SEO scores after you publish — Clearscope Content Inventory lets you do just that.

Content Inventory to track SEO success
You can use Clearscope’s Content Inventory dashboard to track live SEO scores for all of your website pages (blog posts, landing pages, product or feature pages, etc.). We also show you how many clicks each page has received and its estimated SEO value when you link Clearscope with Google Search Console — more on that solution later.
The process is simple: Just paste the page URL and add the target keyword. From there, the page is automatically saved to your dashboard with the current SEO score. You can add as many links to this dashboard as needed.
Our Content Inventory dashboard always shows the most up-to-date SEO scores so you can easily see how specific pages perform for target queries.
Here’s how it works:
Clearscope AI constantly monitors search engine changes — algorithm updates, new competitor content, SERP features, you name it. We essentially perform continuous SERP research for every target keyword you save.
Then, we analyze and compare your page content to determine how it competes against other pages on the SERP.
You can access this dashboard — at any time — and see real-time SEO scores for all your saved pages.
It’s easy to spot content that needs re-optimization because every page has a clear grade. In the screenshot above, you can see a green A+ for NerdWallet’s post on Best Credit Cards; their content manager could check this page grade and be able to tell that the content is still competitive.
Content that requires attention is labeled with red C, D, or F grades (depending on how much attention it requires), so you can add those URLs to your queue for updates.
The Content Inventory dashboard handles tedious content auditing and offers a high-level view of your content’s SEO performance, so you have clear direction on where to focus your attention.
Read more: On-Page SEO Checkers to Audit Site SEO & Write Optimized Content
Keyword rankings
As we mentioned earlier, keyword rankings are an obvious metric to track search engine performance. Many SEO tools, like Ahrefs (what we use) and Semrush have dashboards to create custom rank trackers. You can add the specific keywords from your content plan, and the report shows:
Which URL ranks for the query
The current rank position
How rank position has changed over time (you can see where content indexes and if movement is positive or negative, then monitor the rate of change)
If content appears in a featured snippet
Your average position in search engines (across all web pages)
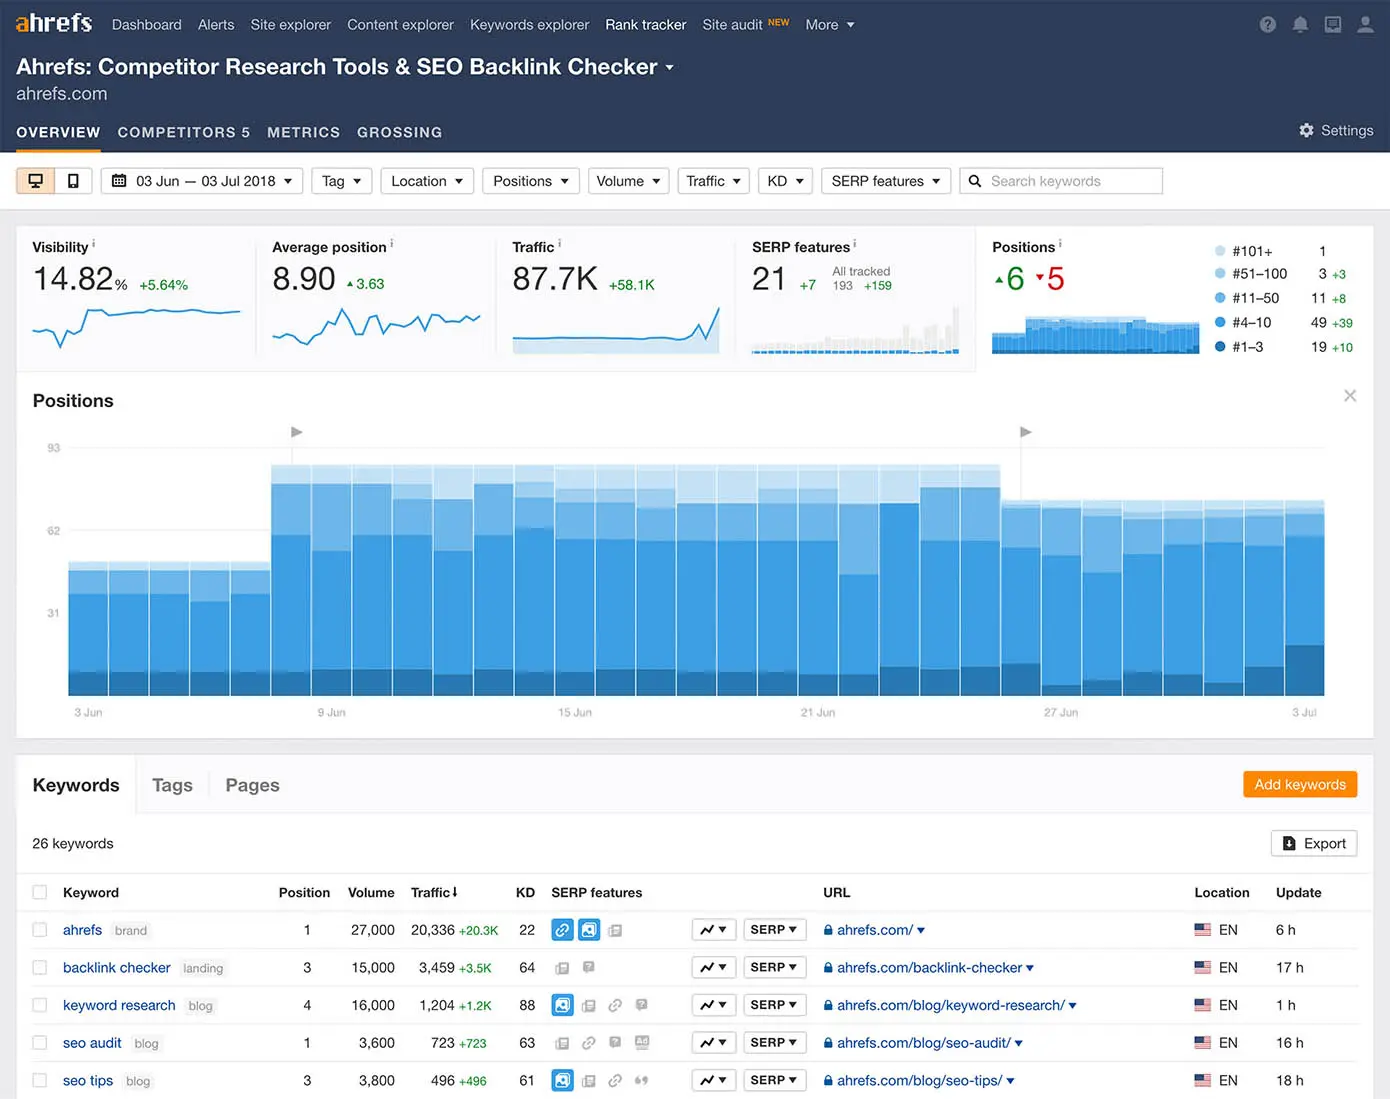
Ahrefs Rank Tracker, monitor page rank for specific search queries
By regularly checking rank tracking reports, you can:
See which posts struggle to gain traction and move towards page one — then you can schedule these pages for updates.
Spot posts that show negative movement in SERPs — then you can troubleshoot before rankings fall too far.
Identify posts that show positive movement in SERPs — then you can prioritize these posts for backlinks and continued promotion to build upon the momentum.
Monitor page-one content — then you can implement strategies to promote content to the very top-most positions and maintain first-page rankings.
Then, ultimately, you can follow strategies to push all your published website content to the top of organic search results. Isn’t that the goal?
Note: It’s worth mentioning that Google Search Console (which we’ll talk more about later) also shows a list of search terms your site ranks for. While this is helpful, GSC doesn’t let you track rankings for specific search terms. So if you want to see where your site ranks for keywords on your content plan — which is most teams’ goal at this step — you need a custom rank tracker.
Organic traffic
Organic traffic (vs. general site traffic) is another valuable metric for monitoring SEO performance because it shows how many users visited your site after finding you in search results.
The best tool for this is Google Analytics because you can access dozens of traffic reports, create custom reports, and dig into traffic sources/audiences to really understand who’s finding you and how. Plus, this is a (mostly) free tool that’s accessible to anybody with a Google account.
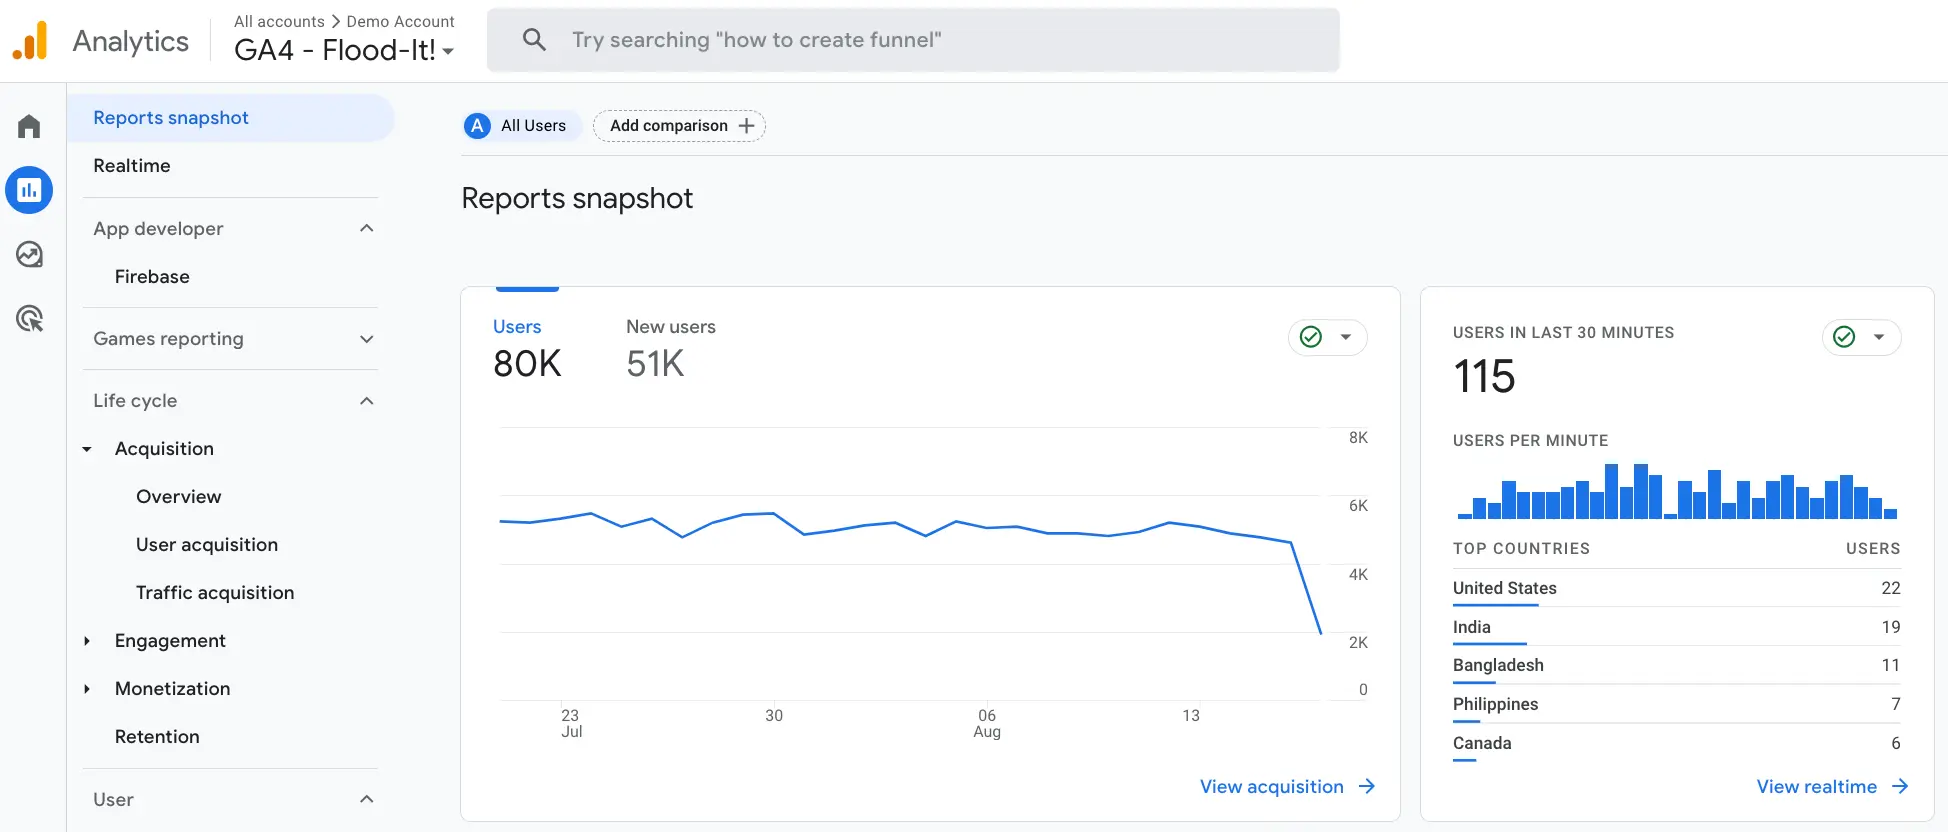
Google Search Console traffic-tracking tools
You can modify reports to see big-picture traffic numbers or zoom in to view traffic for individual web pages, and you can view data over different time frames to compare past and present SEO metrics.
Then, if you notice traffic numbers decline, you can identify which pages see fewer visitors and plan your course of action.
Organic click-through rate (CTR)
Now, in comparison to organic traffic, an arguably more valuable metric is click-through rate (CTR) — this shows how many times your content was viewed in search results (impressions) and how many clicks it received.
A high click-through rate (generally anything over 3% for organic) means that people are commonly choosing your content over competitors. Yay!
But a low click-through rate means your content isn’t capturing searchers’ attention — so they’re clicking on competitor sites instead of visiting yours.
So while organic traffic highlights your wins, CTR shows the gap of missed opportunity — by improving CTRs across website content, you’ll receive more organic traffic and close that gap.
We recommend Google Search Console (another free SEO tool from Google) for this analysis. Upon opening the GSC dashboard, Google automatically displays total impressions, total clicks, and average CTR for all site content.
Then you can scroll through the report to see impressions and clicks for individual web pages — and calculating the CTR is as easy as dividing clicks over impressions.
For example, if your content had 100 clicks and 1000 impressions, the CTR would be 10%.
Normally, the first method to remediate low click-through rates is to update your web page’s SEO title or meta description, as these are the titles and descriptions that users see in search results (and what you’re relying on to persuade them to click). Clear, attention-grabbing, and unique titles help you stand out against the competition and earn more organic site traffic.
Note: You can also link your Google Search Console account with Clearscope to access this data in our Content Inventory dashboard.
Time on page (aka average time per session)
Time on page is mostly self-explanatory — this tells you how long readers engage with content before leaving. As you can guess, longer engagement times tell Google that your content is interesting and valuable since it keeps readers on the page. Alternatively, if readers are leaving after spending <1 minute on your content, it sends Google the opposite message.
Tracking time on page is important because it speaks to the true quality of content — you can see which content pieces actually hook users and which ones flop. If you notice unusually-low engagement times, you know something within the content isn’t working, so you can revisit the page and make changes.
You can track this SEO metric via the Google Analytics Pages and Screens report. Upon opening the report, you’ll see “Average engagement time” as a default metric. Then you can filter the report by landing page or query string to see metrics for specific site pages.
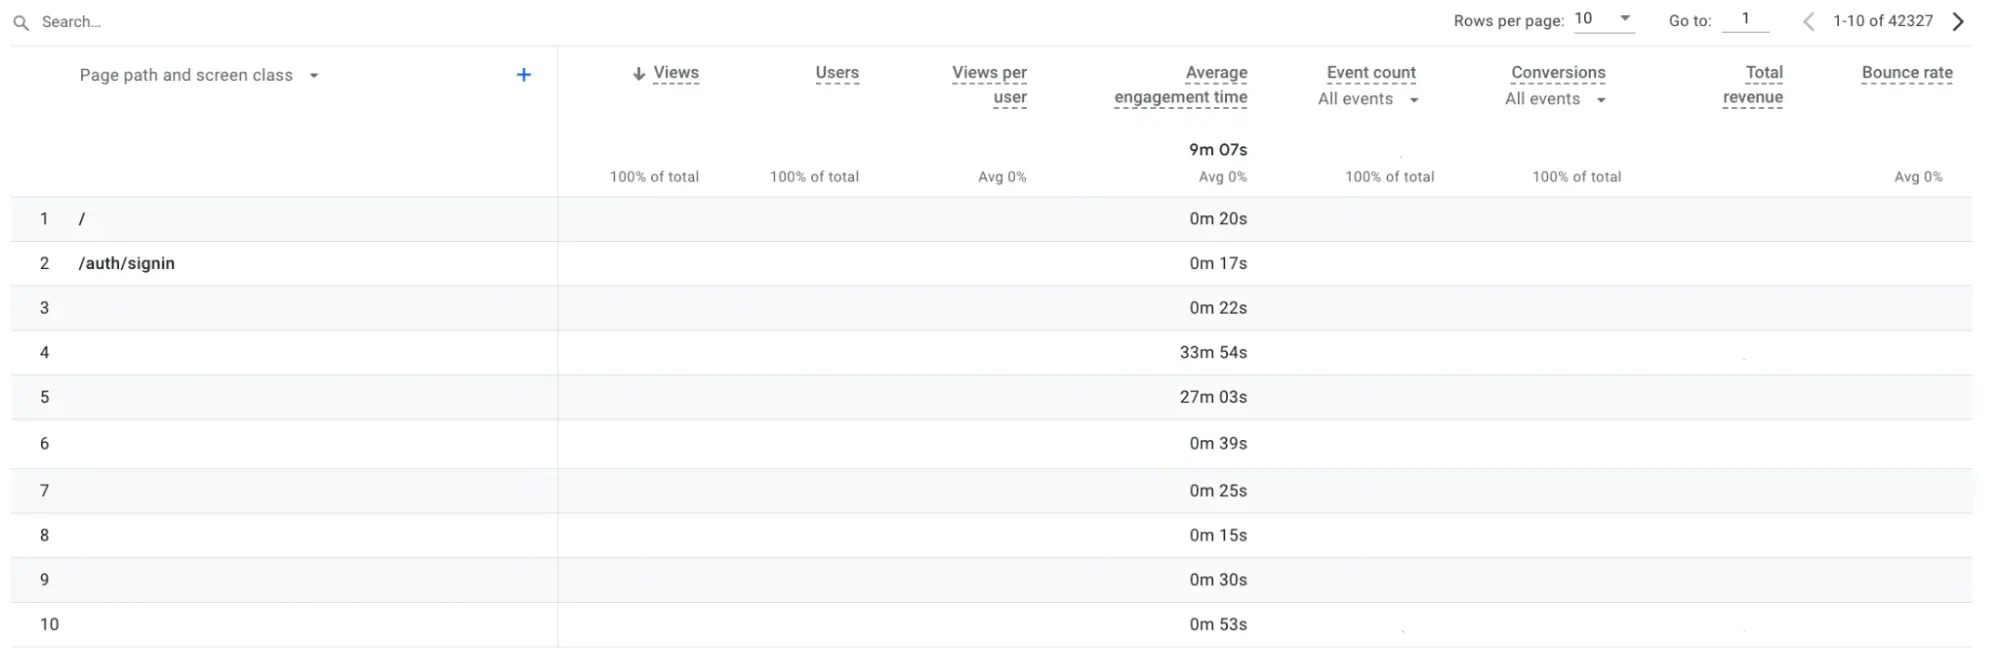
Average time on page in Google Analytics
Conversions
Tracking conversions from content is absolutely essential if measuring ROI from content marketing is important to you. This tells you if content accomplishes the goal you set for it — does it convince readers to take the next steps with your brand (i.e., request a demo, sign up for your newsletter, or make a purchase)?
You can create and track different conversion events, depending on your high-level goals for marketing and focused goals for specific pieces of content. For example, eCommerce brands may want to track product sales from blog content, while marketing agencies may want to track newsletter sign ups or consultation requests.
Then, there are two ways to look at conversions from content:
You can count the number of conversions from individual web pages and see exactly how many leads came from a piece of content in a given time frame.
You can look at average conversion rates from content pieces to get a broad idea of the page’s “success rate.” If a particular content piece brings in thousands of visitors but only converts a handful of people, it’s probably not performing as well as it could.
Understanding what converts and what doesn’t is extremely valuable to your content strategy because you can identify which pages “get the job done,” so to speak.
All of the metrics we’ve discussed thus far provide insight into the searcher’s journey — Are they finding you in search engines? Are they choosing you over competitors? Are they spending time with content? — but conversions and conversion rate tells you which content pieces actually drive new business.
These insights are useful for guiding future digital marketing efforts because you can apply successful strategies to new content creation, troubleshoot low-performing pieces, and avoid repeating past mistakes.
The best tool to track conversions from content is Google Analytics — you can create conversion events around your goals, then build custom reports to track conversions from particular web pages. There are several ways you could approach this in GA, so here’s a link from Google to help you get set up.
Bounce rate
Bounce rate is an important SEO metric because it shows you how many visitors left (or “bounced”) after engaging with a (singular) web page — instead of continuing their journey on your site (like visiting other pages, filling out a contact us form, making a purchase, etc.).
Bounce rates above 70% are red flags; average bounce rates are anywhere between 20-70%, but “good” bounce rates are 40% or lower.
You can track bounce rates for individual site pages via Google Analytics.
Here are the steps in GA4:
Open the” Pages and Screens” report to see a breakdown of the pages people are visiting on your site — you can filter this report to look at metrics for specific web pages or create custom reports to track SEO metrics, like conversions or bounce rates, for select web pages.
Click “Customize report” on the right-hand side.
Select “Metrics” and choose “Bounce rate”.
Here you’ll be able to see the bounce rate for each page on your site and spot the pages with high BRs. In the screenshot from our dummy report below, you can easily see which pages need attention.
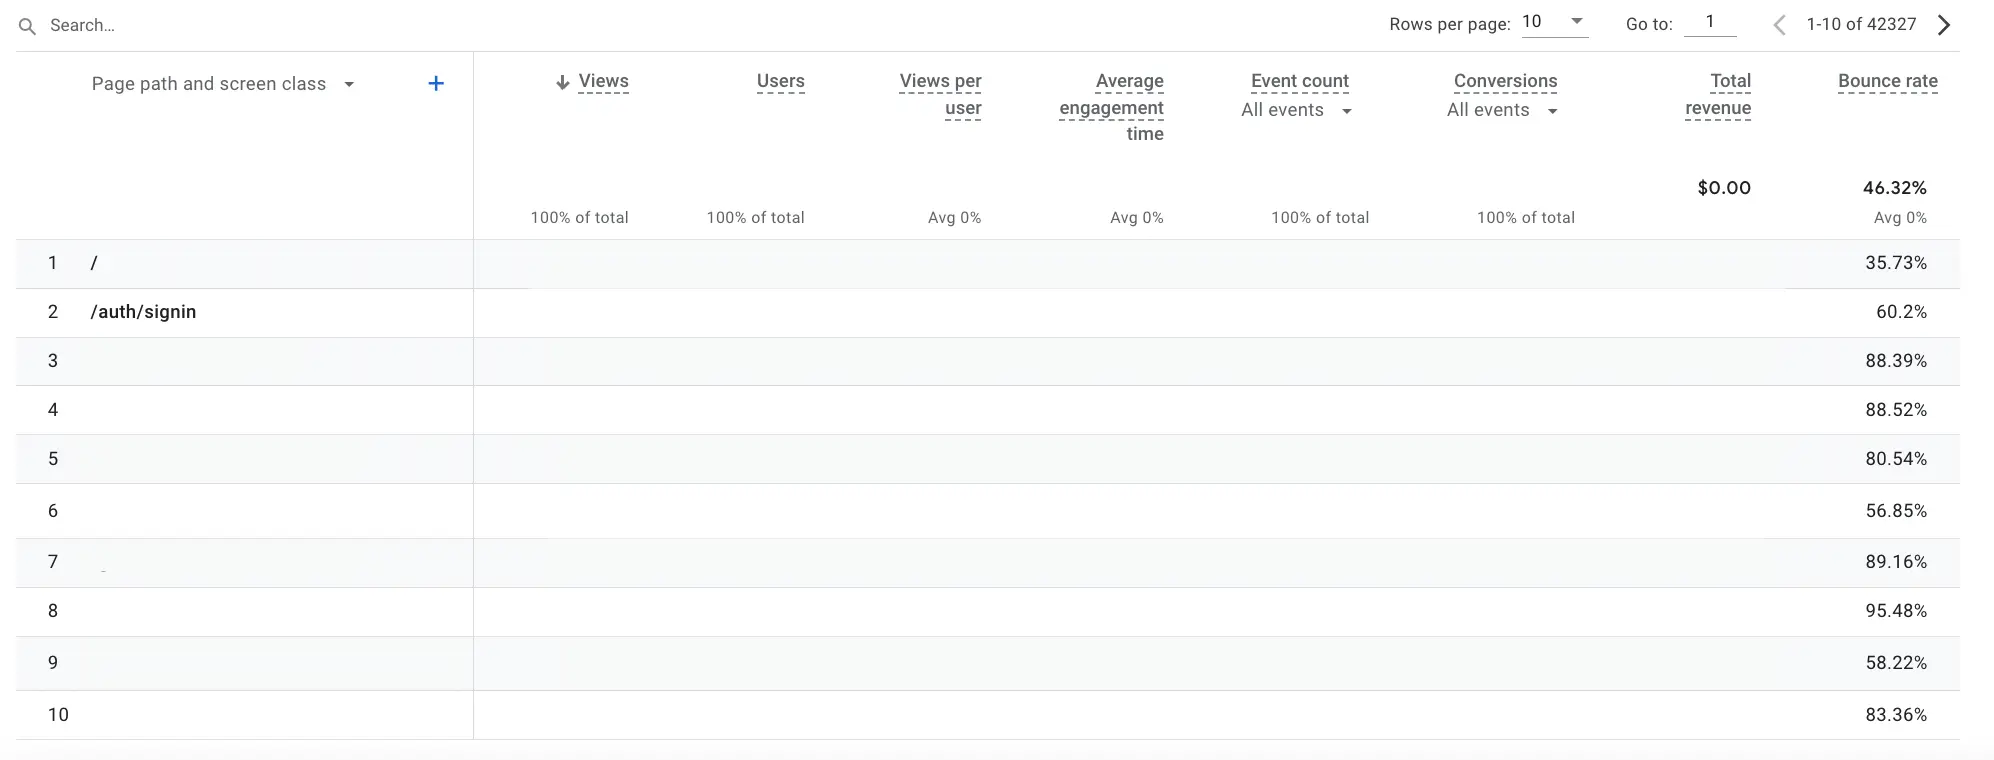
Bounce rates in Google Analytics
If readers spend time engaged with content, that’s wonderful — you were able to grab their attention and provide them with some value.
But if that’s all content accomplishes (i.e., it doesn’t spark further engagement or encourage readers to take the action you intended when creating the piece of content) then it’s not super successful in the grand scheme of things.
Ideally, you should aim to minimize bounce rates across all site pages. Even if content wasn’t designed to encourage a particular outcome (like boost demo requests or product sales), you should still make a conscious effort to keep readers on your site for more than one page — perhaps you internal link related blog posts that users may find interesting so they can continue their research without leaving your site.
If Google sees that your content draws in visitors from search engines, interests readers, and keeps users on your site, Google is likely to keep recommending you — and push your site higher in search engine results pages; this user engagement indicates you have helpful information for searchers.
SEO backlinks
We also recommend reviewing backlinks and referring domains during your SEO audit. Backlinks are links from other sites that point back to your content, and referring domains are the sites that refer users to your content.
In the most simple terms, you can think of every backlink as a recommendation from another site — when you have 10, 15, or 20+ high-quality sites recommending your content, Google can assume you have valuable information for readers.
Well-crafted backlinks from authoritative sites can boost your website SEO; they help you achieve a higher DA (below), improve rankings for site content, and increase search visibility.
Low-quality backlinks hurt your site's SEO and have adverse effects on DA and rankings.
Most teams follow linkbuilding strategies to source links from other sites and boost organic rankings, but you’re not always aware of every backlink your site earns — think about the sites you’ve linked to without notifying the webmaster; you just added the link because it was genuinely helpful.
If you offer genuinely helpful information for readers, or you’re a well-known name in your industry, there’s a good chance other sites will link back to you organically — and monitoring your backlink profile lets you see the full range of sites that refer readers to your content.
When reviewing backlinks, look at the site referring you, the page that links to your content, and the actual anchor text used. You can also open site pages to explore further. Then you can assess whether links help or hurt.
If you notice links from unreliable sites (from penalized domains or sites with low DAs) or you see links more or less “forced” in content (placed in contexts that don’t fit with anchors that don’t relate), you should disavow the link or contact the site owner to update it.
Ahrefs is a great tool for backlink management — enter your site URL into the Site Explorer to see:
URL Rating (UR) — this is the general grade or strength of your backlink profile.
Domain Rating (DR) — this measures how your backlink profile compares to others in the Ahrefs database.
The total number of backlinks to your site — with a list of sites that link to you, including the referring page, anchor, and target URL.
Broken backlinks
Referring domains — with data about each site, like domain rating and information about the sites that link to them.
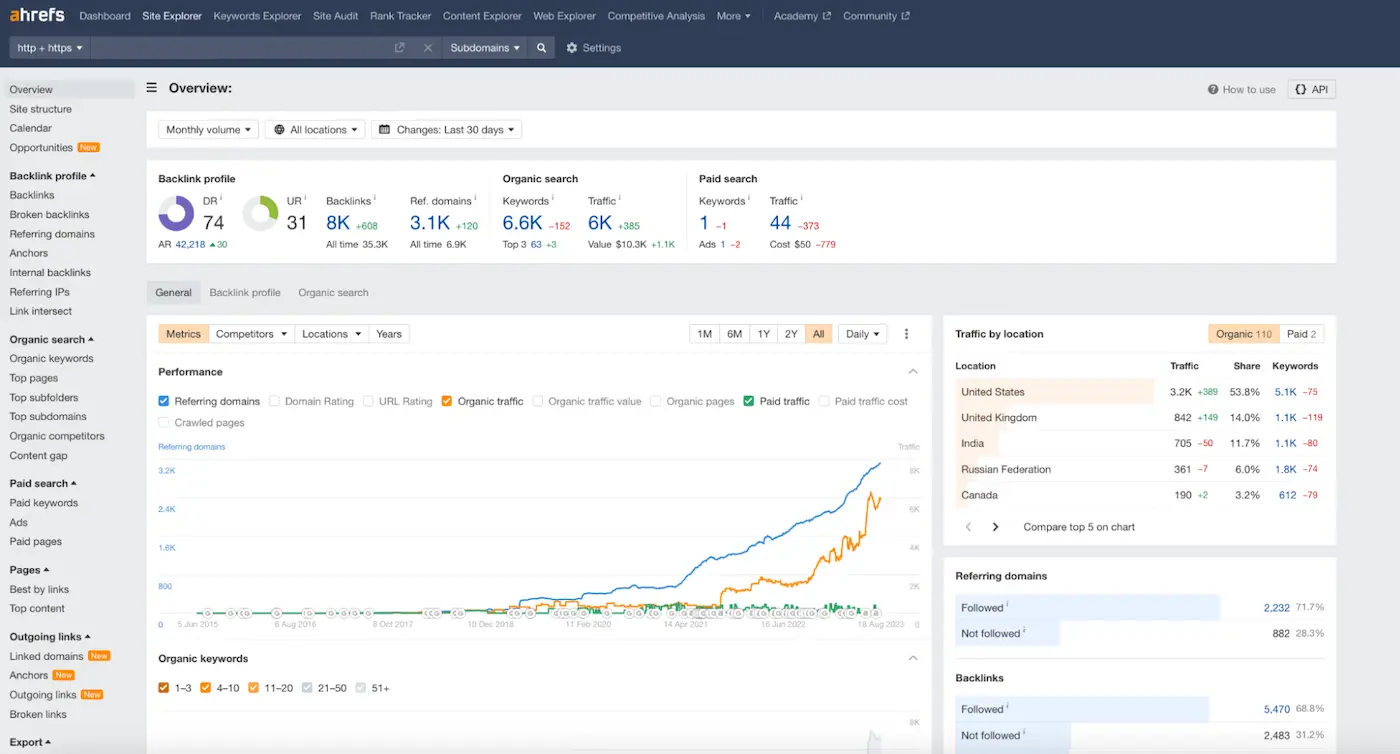
Ahrefs Site Explorer and backlink management tools
You can monitor new backlinks and referring domains and track your SEO progress in the Ahrefs backlink manager.
Note: You can use Site Explorer to research any URL, so you can also use Ahrefs to review competitors’ backlinking strategies.
Bonus: Domain Authority (DA)
The last metric to consider is your site’s domain authority; this grades your site on a variety of criteria — referring root domains, backlinks, content quality, social media engagement, SEO performance, and more — to offer a general prediction of how your site will perform in search engines.
But there are some confusions and misconceptions when it comes to domain authority, so let us explain:
First, Domain Rating and Domain Authority are often used interchangeably; while they are very similar, DR is measured only by comparing your backlink profile to other sites’ backlink profiles, and DA is calculated by looking at a wide range of website performance and SEO metrics.
That said, you can check one or the other and get the same general idea of predicted SERP performance — some sites, like Ahrefs, only show DR, but they advertise that as their domain authority checker.
SEO tools calculate domain rating and domain authority in different ways; the Ahrefs process is unique from Semrush, and Semrush uses a different method than Moz. However, the scores across platforms should be mostly consistent, so you can use a variety of tools to check this data.
Domain authority and rating are not confirmed ranking factors, so Google doesn’t look at these scores when evaluating your site's SEO. However, it does check all the metrics used to calculate these scores — that’s why it’s important to stay on top of this grade and find areas to improve SEO efforts.
Create top-performing content in Clearscope
Checking Clearscope Content Inventory, Ahrefs, and Google apps once every week or so lets you stay on top of site SEO and content. You can track all of these key metrics and see how users find and engage with your site — they provide visibility into every step of the user journey so you can pinpoint where to make improvements.
Are searchers not finding you? Improve rankings. Are users not clicking on you? Remix your SEO title and description. Is content not engaging or converting readers? Time for a refresh.
Clearscope aids in SEO monitoring and content development — in addition to Content Inventory, our platform includes:
Keyword research tools to find topics and build content plans.
SEO reports that guide SERP research, help you understand search intent, and show you what to include in outlines and drafts.
We have a variety of packages to accommodate individuals and growing teams, but we also offer custom plans to create packages around unique requirements. Every user has full feature access, and we provide free report sharing so you can add writers to the platform without fees.
How to Get On the First Page of Google SERP: 8 SEO Strategies
We review the best SEO strategies to produce high-quality content & get on the first page of Google search results. See how Clearscope supports your teams.
Enterprise SEO Tools to Support Content & Boost Site Rankings
Our post talks about six enterprise SEO tools to guide digital strategies, help you see better ROI from content marketing, and report on the success of projects.
12 Content Promotion Strategies To Strengthen Your Content Marketing
Content promotion is crucial for your content to reach a wide audience. Let’s explore content promotion strategies to boost B2C and B2B content marketing.